
📊 BTCUSDT June 2026 — Crowd Liquidity Backtest
Backtest that turns TradingView crowd ideas into a tradable signal: an elite author whitelist trained by the
Simulatorentity (ban rule found by grid search, not hardcoded), entries on any post of a proven author, exits by a 2% trailing take. +19.80% on a month where BTC fell −20.4%.




The strategy consumes a scrape of public TradingView ideas (author, direction, publish time) for June 2026. The whole pipeline is reproducible: scripts/simulator.mjs runs the framework's Simulator entity over the ideas feed and writes the trained artifact to assets/sweep.report.BTCUSDT.json — the author whitelist and the winning exit parameters. The strategy loads the ban list from that artifact at startup and enters on any post of a whitelisted author (N=1). Positions close on a trailing take (2% pullback from peak PnL), a 4% stop, or a 5-day hold cap.
Strategy: jun_2026_strategy | Exchange: ccxt-exchange | Frame: jun_2026_frame
🚀 Quick Start
Link to the source code
# 1. (optional) regenerate the trained artifact — whitelist + parameters
node ./content/jun_2026.strategy/scripts/simulator.mjs
# 2. run the backtest
npm start -- --backtest --symbol BTCUSDT ./content/jun_2026.strategy/jun_2026.strategy.ts
🔍 Methodology
The raw hypothesis — "follow the crowd" — loses badly: entering on every consensus window with tight exits gave −24.23% on this month. The edge appears only after filtering who is worth following.
The Simulator entity profiles every idea with one 5-day candle pass (excursions by wicks, fees and slippage in fill prices) and evaluates a 3,456-point grid arithmetically from the profiles: hard stop × trailing take × hold × consensus threshold × author ban rule. The ban thresholds are grid axes like everything else — the rule is searched, not assumed. All three ranking criteria (time-based Sharpe, Sortino, PnL) converged on the strictest rule offered: an author is allowed only with ≥ 5 fully observed ideas at ≥ 60% hit rate. That leaves 5 authors of 167 (TradingShot, XAUxBTC_Pro, melikatrader94, Lunadigital, ICmarkets — 36 ideas of 343), everyone unproven is banned by default, flood is deduplicated (one idea per author per direction per 8h).
With an elite whitelist the consensus requirement became redundant: a single post of a proven author is the signal (a 2-author consensus fired only 4 times in the whole month). The winning grid point — H=4 / TT=2 / hold=120h / N=1 — expected +26.51% in the simulator; the engine delivered +19.80% (transfer ratio 0.75, the cost of VWAP fills versus wick-level fills).
Honest caveats, stated in the strategy header as well: metrics are train-on-train (both the ban rule and the five authors are selected on the same June they trade — partially a tautology), the edge is confirmed on BTCUSDT only, and the out-of-sample check (July) has not been run yet.
📉 Price Context (June 2026)
| Metric | Value |
|---|---|
| Period | Jun 1 – Jun 30, 2026 |
| Ticker | BTCUSDT |
| Frame open | ~$73,674 (Jun 1) |
| Frame close | ~$58,625 (Jun 30) |
| Period high / low | ~$74,092 / ~$58,115 |
| Net move | −20.4% |
June 2026 was the worst BTC month in two years: a grinding decline from $74k to $58k with brief relief rallies. The unfiltered crowd kept posting longs into the fall; the whitelisted authors leaned short — 9 of the 10 trades are shorts riding the decline.
✨ Performance Summary
Before (unfiltered crowd-following)
| Metric | Value |
|---|---|
| Total trades | 39 |
| Net PNL | −24.23% |
| Win rate | 59% (23 / 39) |
| Avg win / avg loss | +0.7% / −3.4% |
| Stop-outs | 11 × ≈−3.4% |
After (elite whitelist + grid-searched ban rule)
| Metric | Value |
|---|---|
| Total trades | 10 |
| Net PNL | +19.80% |
| Win rate | 90.00% (9 / 10) |
| Expectancy / median PNL | +1.98% / +2.06% |
| Avg win / avg loss | +2.69% / −4.41% |
| Best trade | +7.43% (SHORT Jun 1) |
| Worst trade | −4.41% (SHORT Jun 11, stop-loss) |
| Max win streak / loss streak | 5 / 1 |
| Closed by trailing take | 7 |
| Closed by hold timeout | 2 |
| Closed by stop-loss | 1 |
Risk-Adjusted Metrics
Individual trade PNL values (after): +7.43, +2.94, +0.47, +0.67, +1.08, −4.41, +2.52, +4.99, +2.47, +1.64
| Metric | Value |
|---|---|
| Sharpe Ratio (per-trade) | 0.64 |
| Annualized Sharpe | 7.11 |
| Sortino Ratio | 1.42 |
| Profit factor | 5.49 |
| Standard deviation per trade | 3.09% |
| Max equity drawdown | 7.82% |
| Recovery factor per equity drawdown | 2.71 |
| Avg peak PNL / avg drawdown PNL | +4.21% / −1.98% |
| Peak profit PNL (best excursion) | +9.57% |
| Avg duration (win / loss) | 3,209 min (2,997 / 5,121) |
| Trades per year (annualized pace) | 123.2 |
| Benchmark (buy & hold June) | −20.4% |
Sharpe Ratio here = mean(PNL) / std(PNL) per trade (1.98 / 3.09 = 0.64), annualized via the trade frequency. No risk-free rate adjustment.
Losses live longer than wins (5,121 vs 2,997 min): a losing position has no trailing exit and waits for the stop or the timer — a structural property of the exit design.
📋 Trade Log (After)
| # | Entry | Dir | Idea | Open | Close | PNL% | Exit |
|---|---|---|---|---|---|---|---|
| 1 | Jun 1 08:57 | SHORT | 22103767 | $72,834 | Jun 3 05:12 | +7.43% | trailing take |
| 2 | Jun 3 21:44 | SHORT | 22121998 | $65,431 | Jun 4 02:35 | +2.94% | trailing take |
| 3 | Jun 4 09:15 | SHORT | 22124724 | $63,320 | Jun 5 07:41 | +0.47% | trailing take |
| 4 | Jun 7 21:29 | LONG | 22144386 | $61,821 | Jun 8 05:43 | +0.67% | trailing take |
| 5 | Jun 8 09:03 | SHORT | 22147343 | $63,159 | Jun 10 13:45 | +1.08% | trailing take |
| 6 | Jun 11 08:32 | SHORT | 22167999 | $62,938 | Jun 14 21:53 | −4.41% | stop-loss |
| 7 | Jun 14 22:29 | SHORT | 22187666 | $65,191 | Jun 19 22:29 | +2.52% | hold timeout |
| 8 | Jun 21 18:26 | SHORT | 22228413 | $64,031 | Jun 24 20:09 | +4.99% | trailing take |
| 9 | Jun 25 06:18 | SHORT | 22251220 | $61,752 | Jun 25 14:35 | +2.47% | trailing take |
| 10 | Jun 26 04:59 | SHORT | 22257540 | $59,880 | Jul 1 00:00 | +1.64% | frame end |
The single loss is the Jun 11 SHORT stopped out by the mid-June relief rally after 3.5 days under water. Trade 10 was cut by the June frame boundary, not by its own exit logic.
📈 Equity Curve (After)
| After trade | Cumulative PNL% |
|---|---|
| 1 — Jun 3 | +7.43% |
| 2 — Jun 4 | +10.36% |
| 3 — Jun 5 | +10.84% |
| 4 — Jun 8 | +11.51% |
| 5 — Jun 10 | +12.59% |
| 6 — Jun 14 | +8.18% ← stop-loss |
| 7 — Jun 19 | +10.70% |
| 8 — Jun 24 | +15.69% |
| 9 — Jun 25 | +18.16% |
| 10 — Jul 1 | +19.80% |
🚀 How to Run
npm start -- --backtest --symbol BTCUSDT \
--strategy jun_2026_strategy \
--exchange ccxt-exchange \
--frame jun_2026_frame \
./content/jun_2026.strategy/jun_2026.strategy.ts
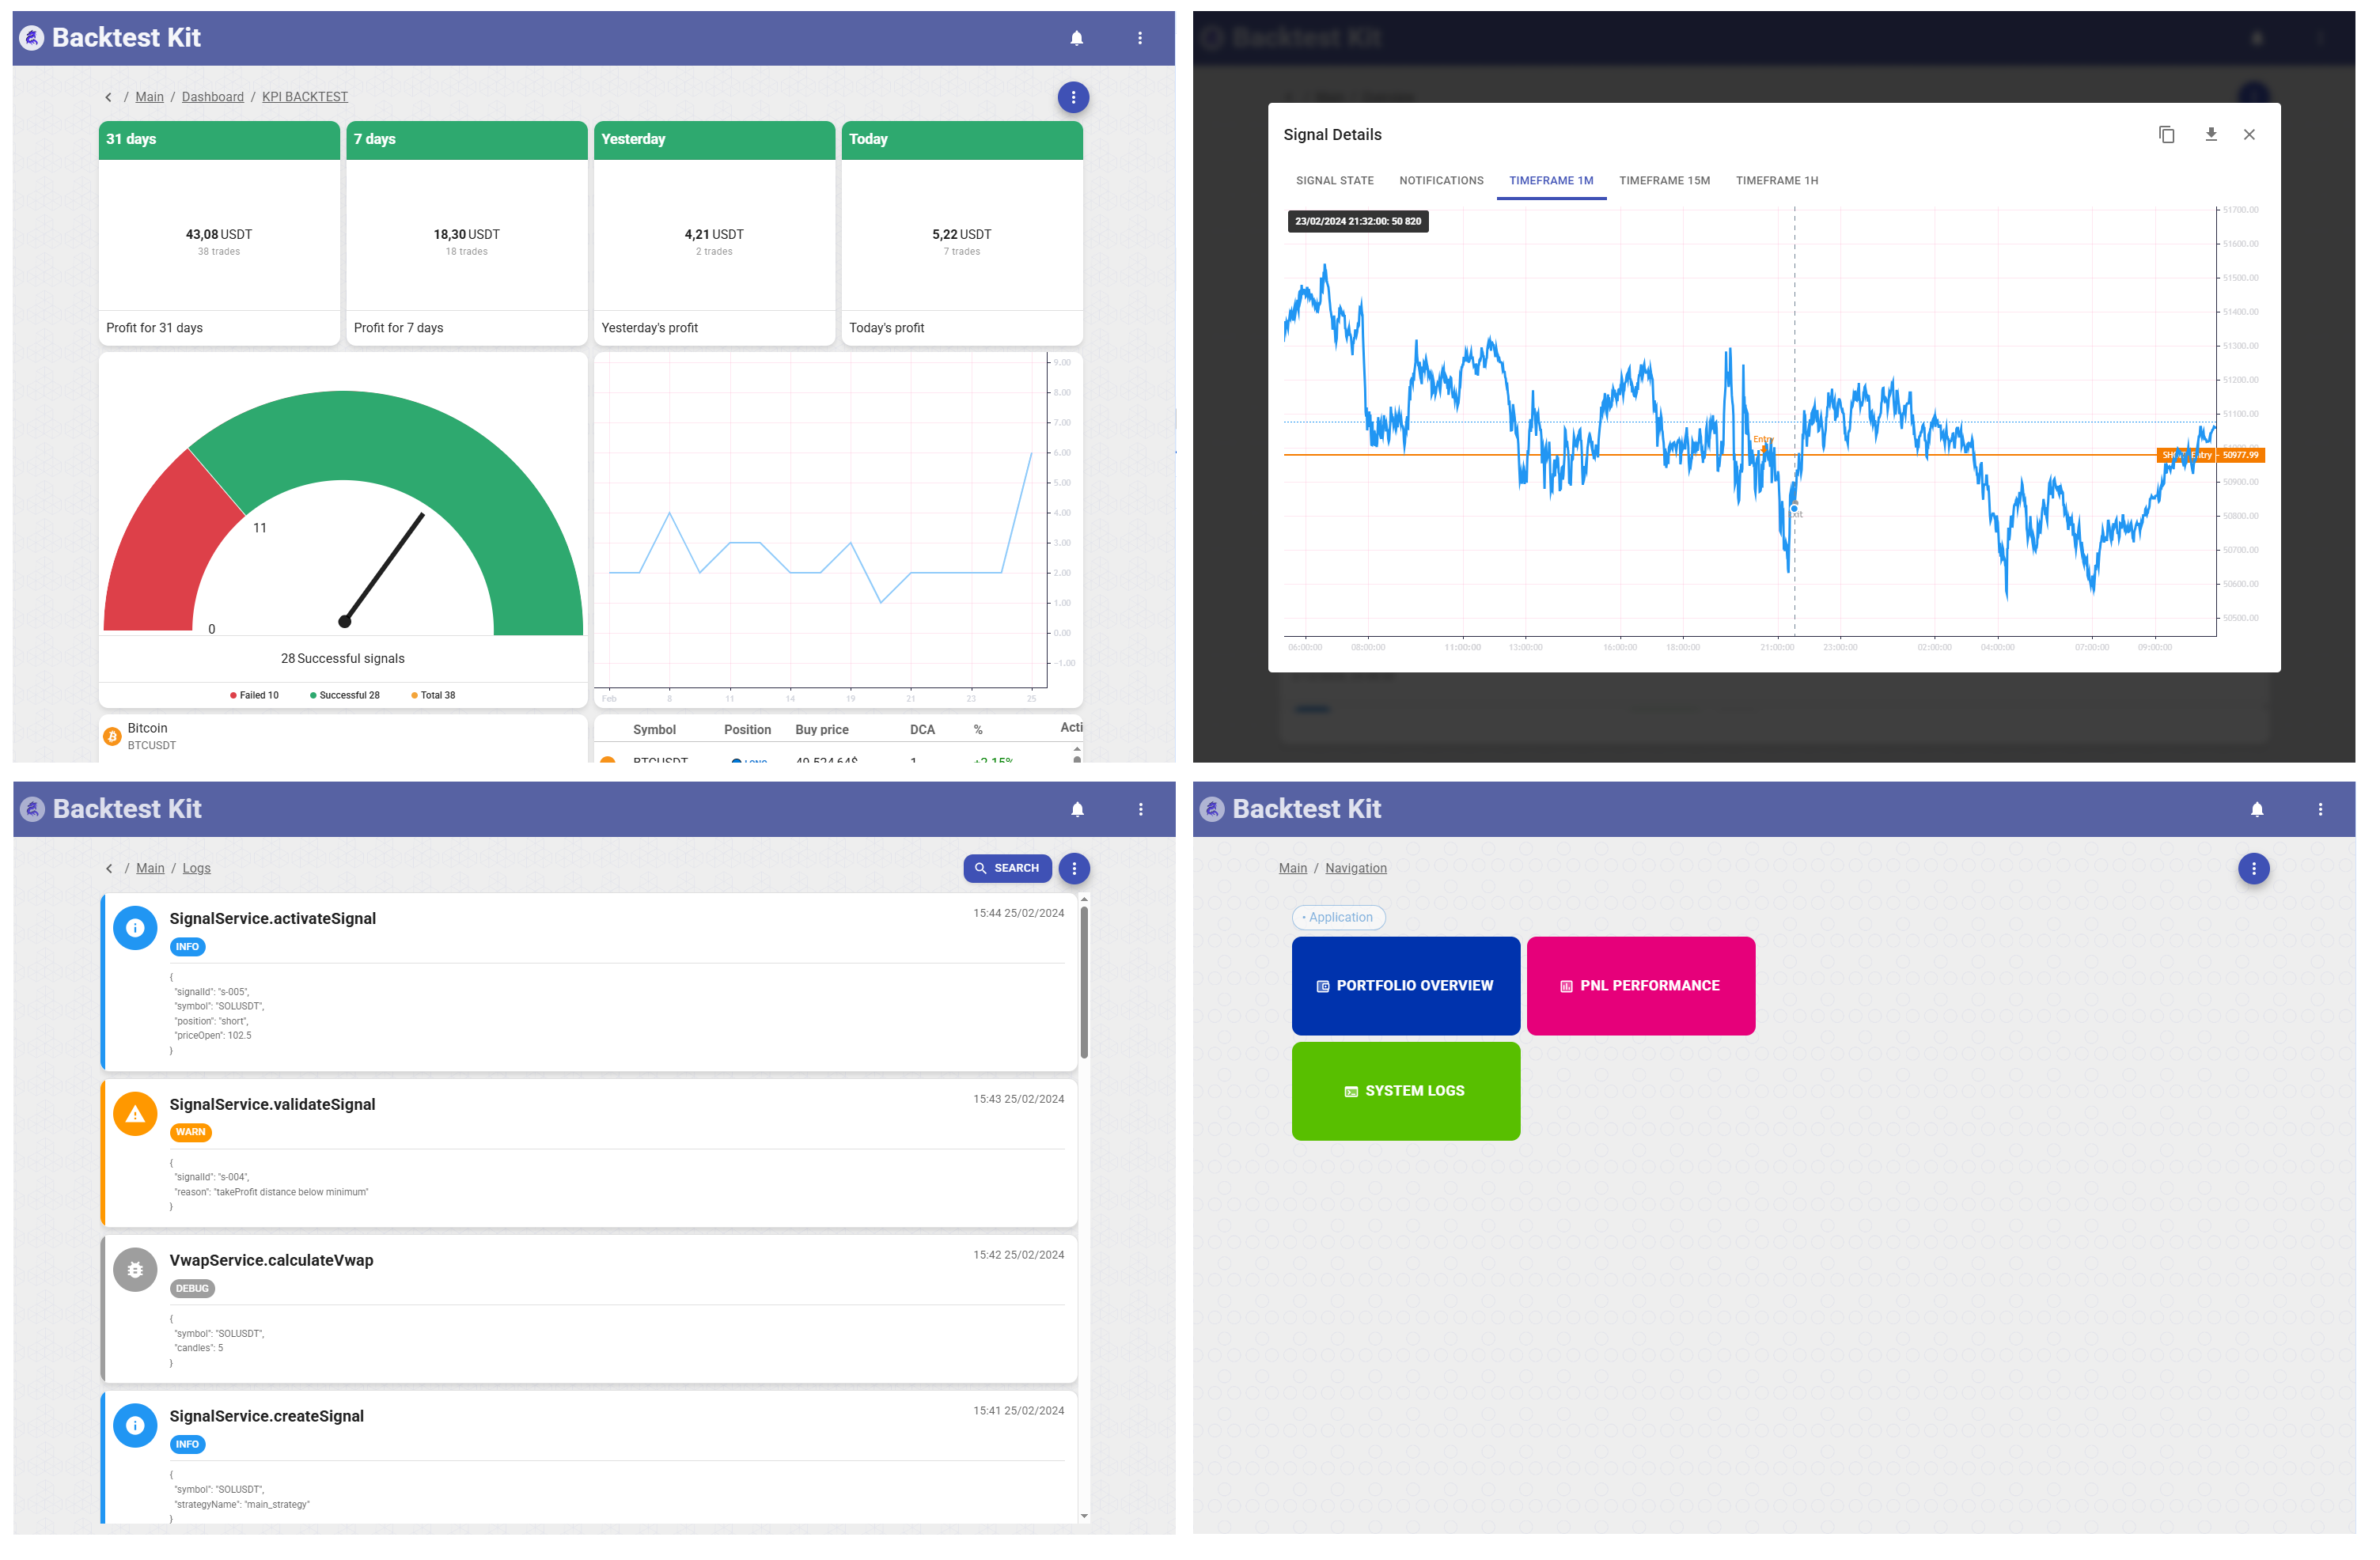
Add --ui to open the web dashboard at http://localhost:60050:
npm start -- --backtest --symbol BTCUSDT --ui \
./content/jun_2026.strategy/jun_2026.strategy.ts
🌍 Environment Variables
Create a .env file in the project root (copy from .env.example):
# Telegram notifications (optional)
CC_TELEGRAM_TOKEN=your_bot_token_here
CC_TELEGRAM_CHANNEL=-100123456789
# Web UI server (optional, defaults shown)
CC_WWWROOT_HOST=0.0.0.0
CC_WWWROOT_PORT=60050